“More colorful than a performance of Swan Lake …” or so Don Lancaster describes the show from a colour organ in his classic 60’s construction article on the “Musette” color organ appearing in a 1967 Electronics Experimenter’s book (The original appearing in Popular Electronics July 1966) and unlike most articles describing construction of such a device, this article outlined the theory of operation including the frequency response of each channel).
The colour organ (or ‘color’ organ for those not employing Canadian English, aka “light organ”) is a device which separates the musical spectrum into frequency bands (called channels) and pulses lamps in time with the music. In its simplest form, it can be a single-channel in which a light simply blinks in time with the amplitude: louder musical programming results in a brighter lamp intensity. More complex devices separate music into low, mid, and high frequency bands (or perhaps even more) with a number of coloured lamps driven from each channel – usually red for the high frequencies, yellow for mid, and blue for low. Early designs used analog filters (RC or LC) using discrete components however these filters suffered from poor separation of channels so a low note, if loud enough, would inevitably cause all lights to illuminate on a multi-channel system. The design presented here uses digital convolution filters which give excellent characteristics (one could even describe these as ‘brick wall’ filters since they feature enormous dB/octave dropoffs, much better than any analog filter could ever deliver).
This is the fourth generation of colour organ that I have built and, unlike previous designs, uses entirely digital filtering (using a DSP chip) for excellent frequency band separation – a natural for me since I developed a DSP course, CTEC1631, at Niagara College in 2005 for the department of Computer Engineering Technology. A synopsis of the previous three designs:
Colorgan I, circa 1970’s, was a single channel device built from this schematic in a “101 projects” magazine. It had no frequency separation so the intensity of the light was dependent solely on the amplitude of the musical program. A simple circuit, the signal from the output of an amplifier was sent through a transformer (8 ohm – 1K) which then triggered an SCR.
Colorgan II, circa late 1970’s, was a five channel device, similar to the Musette color organ by Don Lancaster. Five audio transformers were used and R/C filter circuits on the secondaries were used to separate the frequencies for each of the five channels. Like the single-channel device, SCRs were used, driving five coloured spotlights.
Colorgan III, circa late 1980’s, was a big improvement using active filtering (OP-Amp Butterworth filters). This three channel device used opto-isolators between the filters and the triacs allowing the analog circuitry to operate with a non-isolated supply. Finally, a chaser option (using a CMOS 4017 chip) allowed light to ‘chase’ either at a fixed rate (set by a 555 oscillator) or driven via the low channel (so that bass notes drove the sequence). This unit was a hit at many dorm parties at U of W!
All of these designs have two issues though: one in the separation of the frequency bands and two in the handling of signals which vary wildly in amplitude. While the use of active filtering certainly helps the first issue (OP Amp filters have much better band separation than simple L/C filters), all previous designs required adjustment should the program material change in volume: turning the music down or simply playing a song with low amplitude meant adjusting the device to boost gain to the point where the lamps once again lit. (It might be worth mentioning, as well, that all of my earlier designs required tapping the speaker wires of the audio source – somewhat inconvenient for setup). This design attempts to address these shortcomings by the use of digital filtration and a constant-volume algorithm. Other features include a microphone input and a true light-proportional output via a phase-control technique in which the zero-cross of the AC line is sensed and actual turn-on points for the triacs (the point during the AC cycle) are calculated.
For simplicity of design, a Microchip dsPIC Starter Demo board was used which features a 30F6012 processor, 4KHz sampling and reconstruction filters, an 8-bit DAC, and a prototyping area large enough for all additional analog circuitry. With most of the required circuitry on the demo board, only a bare minimum amount of external circuitry was required including a microphone preamplifier, AC drivers, and a zero-cross detector – in many respects this is the simplest colour organ I have ever built (at least the hardware is).
With all major functions performed by software, the ‘magic’ of this colour organ is in the software which separates frequency bands, normalizes input volumes making adjustment unnecessary, and controls the intensity of the lamps using a phase-control system. Major features of the design (primarily software) are now outlined individually below:
Part 1: Digital Filters
All multichannel colour organs separate musical programming into frequency bands, usually using filters. Frequency bands were chosen based on a traditional colour organ design as follows: Low Channel 60-150 Hz, Mid channel 200-600 Hz, and High channel 800-2200 Hz. These would later be changed (as outlined below).
Digital filters are used in this design to omit the need for analog filters altogether (except for the sampling filter which is already part of the demo board). Generally, digital filters can be designed using one of two techniques: Convolution or Fast-Fourier transforms. Convolution is the most general technique and is employed here. Convolution filters can mimic the operation of an analog filter, and in order to do so the impulse response of the filter must be known. The impulse response is simply the resulting output pulse (amplitude samples) when an impulse is applied to the input of the filter. Quite literally, it describes what the output of the filter would be when a single impulse is applied to the filter.
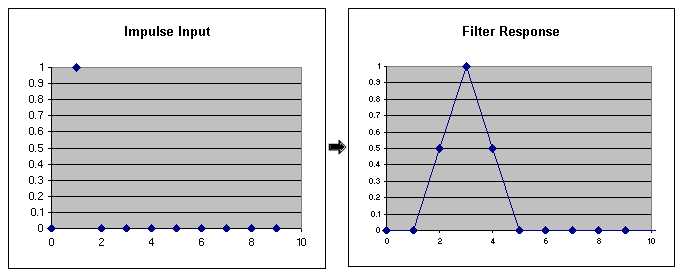
Now, imagine the input signal simply as a series of impulses of varying amplitudes: for each incoming sample (an impulse), the output is known. Consider a square wave input to the filter in the example above: being a low-pass filter the result is approximately a sine wave void of high-frequency components:
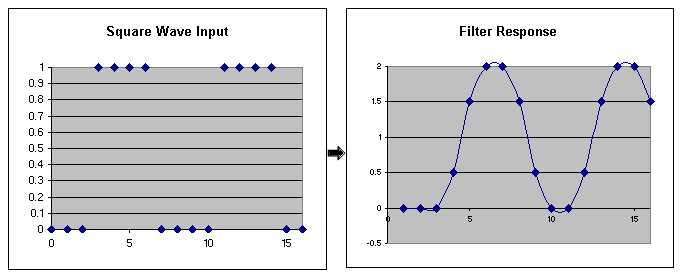
Consider that the square wave can be decomposed into simple impulse responses: four impulses of amplitude zero followed by four impulses of amplitude 1. When the individual responses are considered (each shifted in time from the previous), and then summed, the resulting filter output may be computed.

A real input signal consists of a series of samples, each delayed in time (in our case, an array of samples beginning with the latest): these are the impulses used as inputs to the filter. Each sample (impulse) has a different amplitude (except in the case of our square wave, above) and so the corresponding response of the filter also has a different amplitude but the same basic waveshape. We need only convolute the input sample array against the impulse response (now called the filter kernel) to compute the expected amplitude of the filter to the current sample – this operation requires computing the impulse response for each input sample and summing the resulting amplitude at each time interval. Convolution requires the use of a large number of multiplication and addition operations however the DSP chip is well designed for these types of instructions (called MAC instructions, the destination of which is a large register called the accumulator).
The filters employed here are rectangular window FIR type and use an output-side convolution algorithm from chapter 6 of Smith (The Scientist and Engineer’s Guide to Digital Signal Processing, available on the web for free) in which the impulse response is reversed to form the kernel. The number of samples in the array holding the impulse response must match the size of the filter kernel (the number of samples used to describe the impulse response of the filter). In the first prototype design, 64-tap kernels (the length chosen arbitrarily to match the maximum kernel length supported by the “demo” version of the filter design package employed) were used.
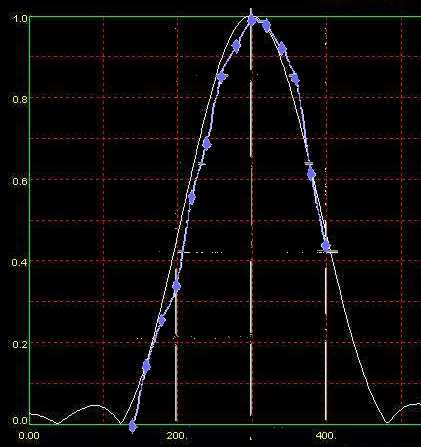
The predicted and measured response of a 64-tap digital filter (the prototype) shows just how closely the filter approximates the mathematically-modeled version. Frequency (in Hz) is plotted on the x-axis and amplitude of the filter output on the y-axis. The predicted response is the white curve, while measured response is the blue curve (with measured points shown as diamonds). In the final version, 256 tap filters were used with even closer response to that predicted.
While performance of the 64-tap filters were adequate for the mid (above) and high frequency bands, performance of the low frequency band was downright lousy and the output consisted of more noise than signal! It should be quite obvious that a kernel with a length of only 64 samples cannot possibly perform well at frequencies below 125Hz (this is a “hand-waving” argument in which, by inspection, the kernel must “cover” at least the number of samples occupied by one full wave). The filter was improved by increasing the kernel size to 256 taps (about 350 would be required for optimal performance, but 256 was chosen arbitrarily and was found to be quite adequate). Coefficients were calculated using a java app from the dsptutor website with coefficients multiplied by 65535 and encoded as ‘hwords’ in the program memory of the processor. The conversion was accomplished using a spreadsheet.
The kernel coefficients, stored in program (x) memory, are accessed via PSV (program space visibility) allowing use of a working register as a pointer. In order to reverse the order of the kernel, as required for the output-side algorithm, the pointer is aligned to point to the last entry (#255) for the kernel. To allow fast access, incoming samples (the last 256) are stored in registers in y memory space and also accessed using a second working register as a pointer. Convolution is then accomplished by using one of the two 40-bit wide accumulators and a MAC dsp instruction with prefetch (so that each MAC instruction executes in one cycle) as follows:
        clr	A
	repeat 	#256
	mac	w5*w6, A, [W8]-=2, W5, [W10]+=2, W6
The MAC instruction multiplies the contents of W5 (the kernel coefficient) and W6 (the sample value) and adds these with the value already in the accumulator (hence the op-code “Multiply and ACcumulate”). At the same time, the instruction fetches the next kernel coefficient (pointed-to by W8) into W5 and the next sample (pointed-to by W10) into W6. Finally the pointer (W8) is decremented to point to the previous kernel entry and (W10) incremented to point to the next sample (these are both words so each pointer is incremented/decremented by 2). Note that this instruction performs simultaneous access to two memory areas at the same time: x and y memory spaces (hence why the kernel must be in one space, and samples in another). When the convolution is complete, the contents of the accumulator are scaled by shifting using the barrel shifter (sftac instruction). This code also illustrates what makes a DSP chip a DSP chip: special instructions such as the MAC instruction which lend themselves well to algorithms such as this and can execute complex mathematical sequences in one machine cycle. Execution of these same functions on a “traditional” microprocessor would consume considerably more machine cycles (and so have a much longer execution time) than the DSP processor is capable of. Never laugh at a DSP chip running at “only” 120MHz: the architecture of the chip allows incredibly fast execution of complex operations.
Three convolutions are completed, one for each frequency band, and the sample array is updated by shifting all entries downwards (with the newest, incoming sample placed at the top of the array).
With the filter algorithm working, filters were tested by routing the output from each filter (separately) to the on-board DAC so that an oscilloscope could be used to monitor each. The on-board DAC (an MCP4101) is only eight-bits but this is sufficient for testing purposes. The board also has a 4KHz reconstruction filter. In this manner, filter performance was verified (and it was very impressive how closely the action of each filter matched that predicted. There were several problems identified with the original filter design notably that (a) the low channel was sensitive to 60Hz AC hum interference and (b) the low channel was not as responsive as the others – apparently, there is little musical programming in the 60-150Hz range in popular music and so the “low” output was hardly ever active (unlike the other two). Both problems were solved by revising the design range of the low channel filter to 90-200Hz incorporating the range of more instruments (including bass guitar and drums) as well as omitting the 60Hz range where copious quantities of noise exist from the AC line (since we are turning triac drivers mid-phase there is bound to be a great deal of noise picked-up by the analog circuitry). It was also noted that the mid channel was too responsive so the range of that filter was narrowed to 250-400Hz (still covered by a large range of musical instruments as well as vocals) and the high channel changed to 500-2000Hz. With the filters balanced in this manner, the activity on each filter channel was approximately the same (although with a real music source it does vary: naturally some musical passages feature increased bass notes while other music features intense highs – it is this variation that makes watching the lamps interesting!).
Finally, the output of each filter channel was multiplied by a gain constant allowing allowing light activity to be increased or decreased. If, for example, the musical programming is weak in bass frequencies, a simple boost in this channel will improve activity.
The gain control works by using the accumulator and a shift (sftac) instruction. Output from the filter is multiplied by a gain constant (in which ‘8’ is taken to be 100% gain) with the result placed into accumulator B. The accumulator is then shifted 11 bits – three for the gain constant and eight to shift the MSB bits from the filter output into the lowest four bit positions which are then masked-off leaving a value ranging from 0x00 to 0x0F in WREG0.
        mov		w0,w4
	mov		#GAIN_HI,w5
	mpy		w4*w5,B		;ACCB = Filter * GainLo
	sftac		B,#11		;Shift by 3 (for Gain) + 8 (for bits 9-12)
	mov		ACCBL,w0
	mov		#0xF,w1		;Mask off 4 lower bits only
	and		w0,w1,w0
Part 2: Constant volume amplifier
In this design, input will be derived from an electret microphone instead of requiring a physical connection to the audio source improving the portability of the device. Regardless of the source, the input amplitude levels can vary over a large range, and so an algorithm is required to adjust input gain to normalize the signal. This was a major problem with early color organ designs since loud pieces of music would result in all lights being turned on continuously and soft pieces result in the lights barely blinking requiring the operator to continually adjust the input level.
Possible algorithms for constant volume include computing an average of the input signal over a given period and setting the gain of an amplification stage (a multiplier) to boost or cut the amplitude of the input signal to match. Another algorithm, familiar to those who have used an old cassette tape deck for recording, is to set the input gain so that peaks all fall within a known range (on my old Sony deck, in the 0 to +3dB range of the VU meter … the “red” area on the meters). This is a simple algorithm to implement with the only concern being the time constant used during which the peak amplitude is captured: during soft musical passages the algorithm should not boost the signal so high that when the music becomes loud again the amplitude is enormous (and so all lights would be on). This time constant must be determined experimentally.
The simple algorithm for gain adjustment works as follows:
- Setup a counter for 16000 (2 sec) or 32000 (4 sec) samples. This time constant can be determined experimentally.
- Clear the “Peak” value at the beginning of this period
- For each incoming new sample, update “Peak” to represent the maximum found (i.e. if the current sample is > peak, update peak)
- At the end of each period of samples, determine the gain by dividing the desired peak by the determined peak. If, for example, the music peak for the last period was 0x300 and the desired peak was 0x4000, the gain would be 0x4000/0x300 or 20 and so all input samples for the next period are multiplied by 20 to boost peaks to 0x4000.
The new gain constant, for the next period, is then computed with the following simple code:
	mov	#TARGETPEAK,w4
  	mov	Peak,w5
	repeat  #17			;Simple Divide (unsigned)
	div.u	w4,w5			;W0=W4/w5 (remainder in w1)
	mov	w0,Gain
“TARGETPEAK” is a constant, chosen arbitrarily to be 0x4000, and “Peak” is the maximum amplitude sample found in the last (two or four second) period. With this new gain figure computed, all incoming samples are simply multiplied by this number using an unsigned multiply (mul.ss).
With very low volume levels, the signal-to-noise ratio is poor and so one option to improve low-volume operation is the addition of a *50 amplifier between the AN3 and AN4 inputs allowing use of AN4 as a “low sound intensity” input. A simple algorithm would then switch to AN2 input if the the input on AN3 falls below a certain range, say, peaks below .40 – this will boost the input signal and improve the dynamic range. Whether this circuit is required or not depends of the volume range normally used in the listening room (in the prototype design a quad MCP6024 Op-Amp was used allowing upgrades such as this if required) – even at comfortably low volume levels the basic system was found to work well and the extra amplifier was not needed.
Part 3: Phase-control of lights
Knowing that each filter has a digital output level ranging from 0 to 0x0FFF (after scaling), the four MSB bits of this value can be used to select 1 of 16 possible light levels to represent the intensity of sound in that band. A simple approach would be to simply divide the 120Hz AC half-cycle into sixteen discrete steps and trigger the scr or triac driving the light at that point however such a scheme results in a light output that is not proportional to the actual amplitude of each frequency band. If equal steps were taken for phase angle the corresponding light output would not increase proportionally on each step since the slope of the sine wave is not constant.
Examining a curve integrating the area under the sine wave (which represents accumulated energy into the cycle) shows that a conversion curve is required to relate the sixteen steps into sixteen firing angles where output will increase in equal energy steps. Linearization (converting each step into a linear increase in light) is accomplished by a table in the PIC which translates each intensity step into a phase angle to bring about a proportional intensity change. Four bits (the four MSB bits from the filter output)are used to represent intensity and so the table translates each of these steps into sixteen firing angles (from zero to 180 degrees) which will bring-about equal changes in lamp intensity (this is done by numerically integrating the total area under the sine curve at each step).
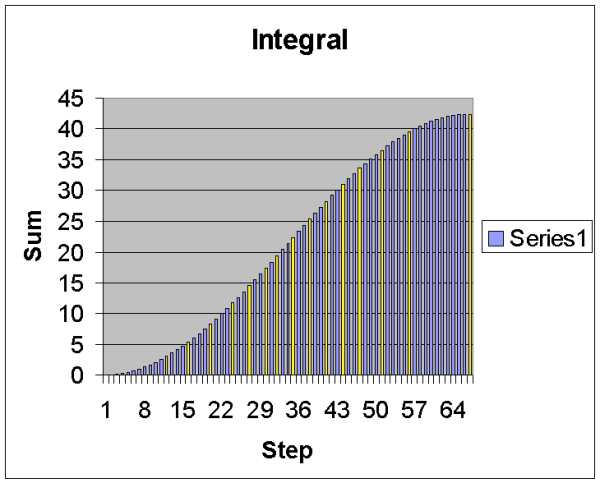
Dividing the AC cycle into 66 firing steps (read below to see how this was determined), the area under the curve at each step (representing the energy in the wave up to that point) is plotted. This allows the energy range of the wave to be separated into sixteen equal steps (shown here in yellow), each of which is separated by an equal amount of energy. This presumes, of course, that an equal increase of input energy into the lamp leads to a proportional increase in light output.
Light output is set to be proportional to the peak amplitude of filter output during the last AC half-cycle. The algorithm works by detecting zero-cross (twice per AC cycle). Three variables PeakHi, PeakMid, and PeakLow are cleared to zero. During the next cycle, each peak (absolute value) is updated from the output of the filters. On the next zero-cross, Peak values are updated for each channel and the cycle repeats. Peak values are then used to set the light level on each triac driver channel for the next half-cycle.
Each driver also features a background setting – the minimum light level which exists even with no sound present. This is simply a phase angle at which the triac triggers regardless (usually at the end of the AC half-cycle) and so represents a minimum light level for the lamps. All three lamps feature an independent background level.
For simplicity, the same timer used for sampling can be used to select a trigger point for the triac drivers. At 8000Hz, a 120Hz half-wave can be triggered on one of 66 points (approximately 2.7 degrees apart). Better resolution is possible if a higher frequency is used (for example, 21600Hz would yield a resolution of one degree) however the resolution used here is more than adequate for this application.
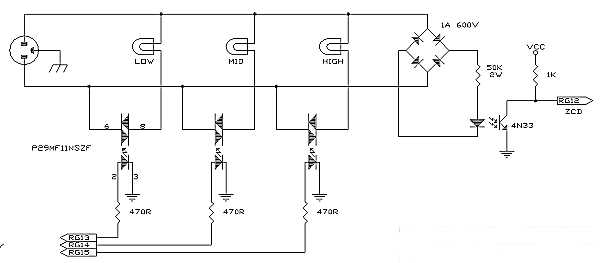
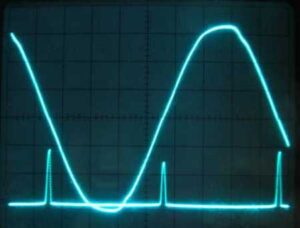 Detection of the zero-cross of the AC line, required for phase-angle control, is accomplished using a 4N33 opto-isolator. To avoid any phase-shift effects, the isolator connects directly to the rectified AC line via a large (50K) resistor. A high-going pulse is produced every 1/120th of a second which defines “zero degrees” of the half cycle.
The zero-cross points of the AC line are seen here on an oscilloscope as the lower trace. When the AC line voltage falls below a few volts, the output of an optocoupler floats high. This occurs twice per AC (60Hz) cycle.
For hardware phase control of the triacs, non zero-cross optocouplers are required to allow instant triggering of the triac gate (the triac turns off when the next zero-cross of the AC line occurs). A suitable optocoupler is the Motorola MOC302x series. Other options include the use of SCRs instead of triacs in which case the AC line can be rectified with a bridge rectifier and the SCR triggered with a single transistor output, albeit high voltage (e.g. H11D) optocouplers. Use of a bridge rectifier also simplifies the zero-cross detector since a single optocoupler can be used for that purpose as well. The most elegant solution is the use of small 8-pin DIP solid-state relays (Sharp PR29MF11NSZF). These SSR’s can drive a 0.9A AC load directly and are non zero-cross devices allowing phase-angle control of loads.
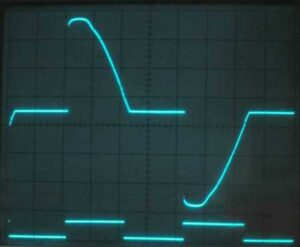 In this photo, the output of the triac drivers (as used to drive the lamps) is seen as a “chopped” sine wave. The lower trace is the control voltage from the MCU. Approximately 60% of the sine wave is produced and so the light level will be slightly over 50% of full brightness. With a wider pulse (i.e. triggered earlier in the AC cycle), the lamp can be made brighter. The control signal must, of course, be turned off at the zero-cross point to prevent retriggering for the next half-cycle.
Part 4: User Controls
Originally, it was planned that the colour organ would feature a set of pushbuttons allowing the user to set filter gain and background level individually for each channel however upon observing operation of the prototype it was evident that these parameters would only need to be set once. Internal to the program, several parameters including channel gain and background level are defined and may be set at compile time. It would be a simple matter to incorporate a user interface using pushbuttons allowing the user to set these parameters “on-the-fly” but it is certainly not necessary.
Code:
Download Colorgan4 as a zip file. This file compiles under MPLAB version 8.43. Designed for a dsPIC 30F6012 chip, it could run on virtually any dsPIC with equivalent features: a 28-pin device would be well suited for this project.
Hardware
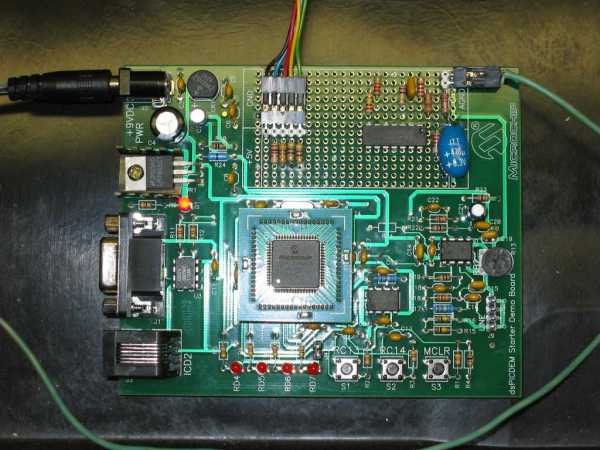
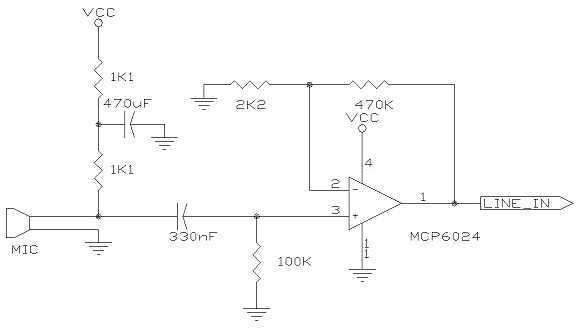
The actual device consists of two boards: the demo board and an AC driver board. The demo board, a Microchip dsPIC starter board, features a 30F6012 processor and a prototyping area. The datasheet for the board, complete with schematics, can be found on the Microchip web site here, an abbreviated version showing only the key circuitry of the board (and derived from the original Microchip datasheet) can be found here: dsPICDemSchematic. On the prototyping area, an MCP6024 quad OP-Amp was mounted for all analog circuitry. The MCP6024 is a rail-to-rail device designed for single supply operation at 5V and so is ideally suited for this application. At present, only one of the four amplifiers in the package are used for a microphone preamplifier, the other sections reserved for future upgrades including an amplifier for low volume usage (as described above).
Weak signals from the electret microphone are first decoupled from the DC bias used to power the microphone, then amplified by a section of the MCP6024 op-amp configured as a *200 amplifier. This amplification was determined by prototyping to ensure that the loudest normal audio levels encountered result in no more than a 5V peak-to-peak signal at the output (i.e. without significant clipping). This amplified signal then passes through a second-order 4KHz low-pass sampling filter already on the demo board and to analog input AN3 on the MCU.
A condensed schematic for the dsPIC demo board can be found here: dsPICDemSchematic. The schematic was composed from multiple schematics in the original PDF from Microchip and details the analog filters already on the board (U5A being the sampling filter). Signals from the microphone preamp enter via the “Line In” connection at the lower left.
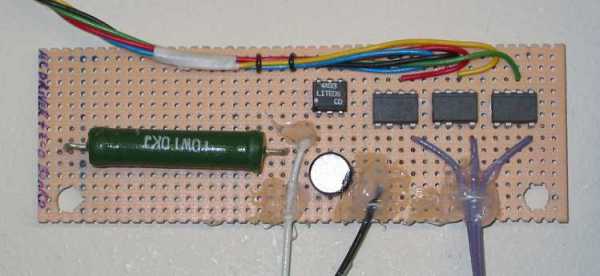
The AC driver board which includes the zero-cross detector and three triac lamp drivers. The large power resistor limits current through the LED of the optocoupler – it is shown in this photo as 10K however was later revised to 50K (exact determination of the zero cross point was not required and so a larger resistor, with lower power dissipation, was used). The entire circuit was built on perfboard and designed to mount into the lamp housing (hence the two large mounting holes). As with any AC wiring, it must be properly insulated for safety. The entire wiring side of the board is covered with silicone sealant to protect from shorts or accidental contact with other wiring.
Assembly
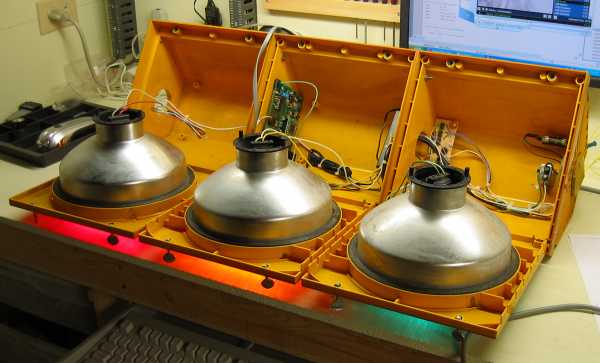
All circuitry is embedded into a stoplight housing (stoplights such as these are commonly available in flea markets). There is precious little room in a newer (plastic) stoplight housing and so all boards must be designed to fit in the odd spaces available. The demo board is mounted horizontally on the partition between the red and yellow lamp housings using two self-tapping screws, the power supply in the middle lamp housing, and the AC driver board in the green housing mounted in two plastic extrusions originally meant for a terminal block. Since no user controls are required, the only holes which must be cut into the housing are an IEC AC connector (on the rear) and a small hole for the microphone which was placed on the front of the stoplight on the yellow lamp front. Should the user desire to modify the gain or background level parameters, the demo board can be accessed by removing the yellow lamp (as is done for lamp replacement) and the ICD debugger may be plugged into the board from there – the six-pin cable with modular connectors was left attached to the demo board allowing easy software modifications.
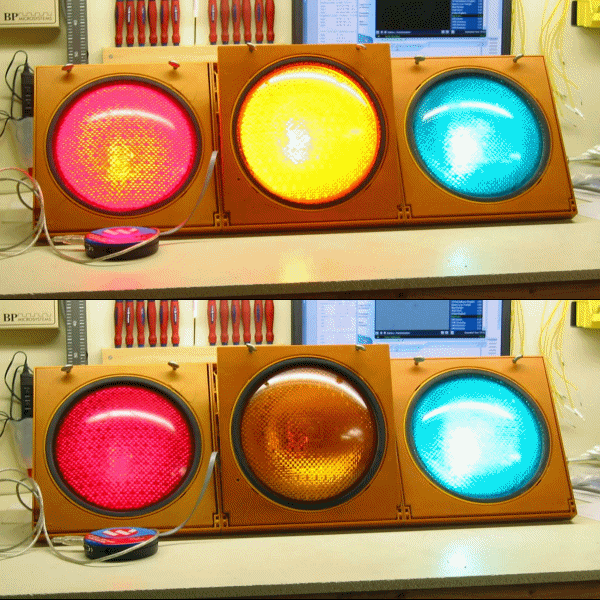
The completed colour organ. Visible in this photo is the ICD-2 debugger still connected to the system – after final assembly “fine tuning” was accomplished by varying the channel gains until lamps responded as intended. As it turns-out, with a decent audio source (not just cheap desktop PC speakers), filter gain was set equally for each channel. Actual gain settings depend on room acoustics and the source employed and must be experimentally determined. Once complete, the program was burned into the MCU (using the ICD-2 as a programmer) and the ICD-2 was removed.
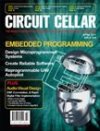 This device is featured in Circuit Cellar magazine (Issue #249, April 2011). The article also contains a in-depth tutorial on the convolution technique.